Page 22
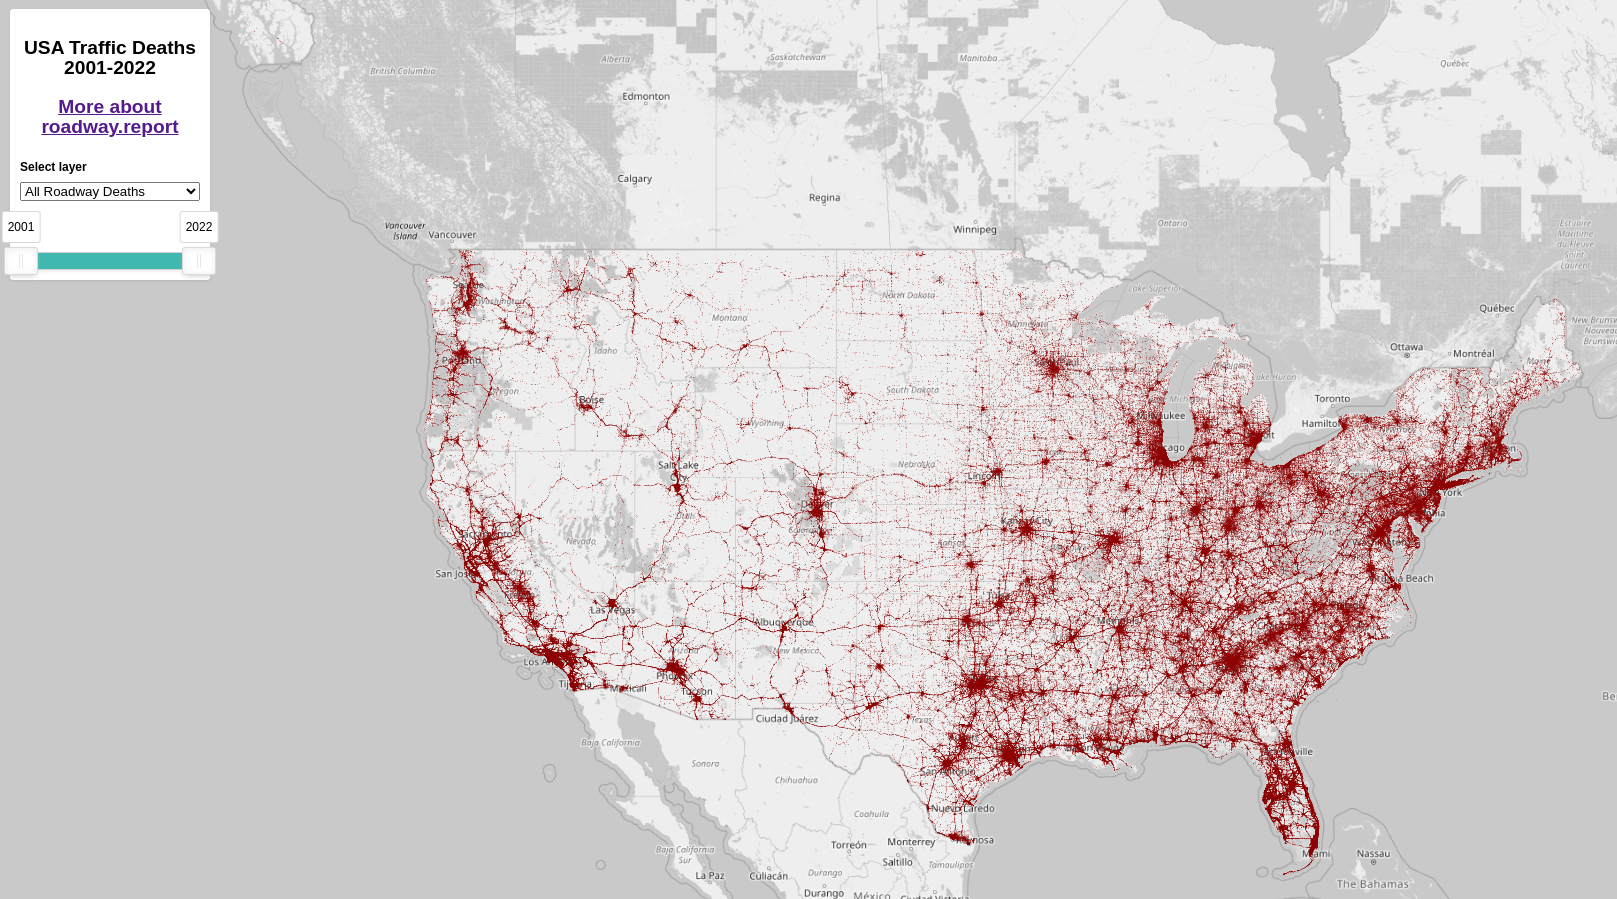
Visualize USA Traffic Deaths 2001-2022
rust-ontologist: Visualizing Rust codebases in a few seconds
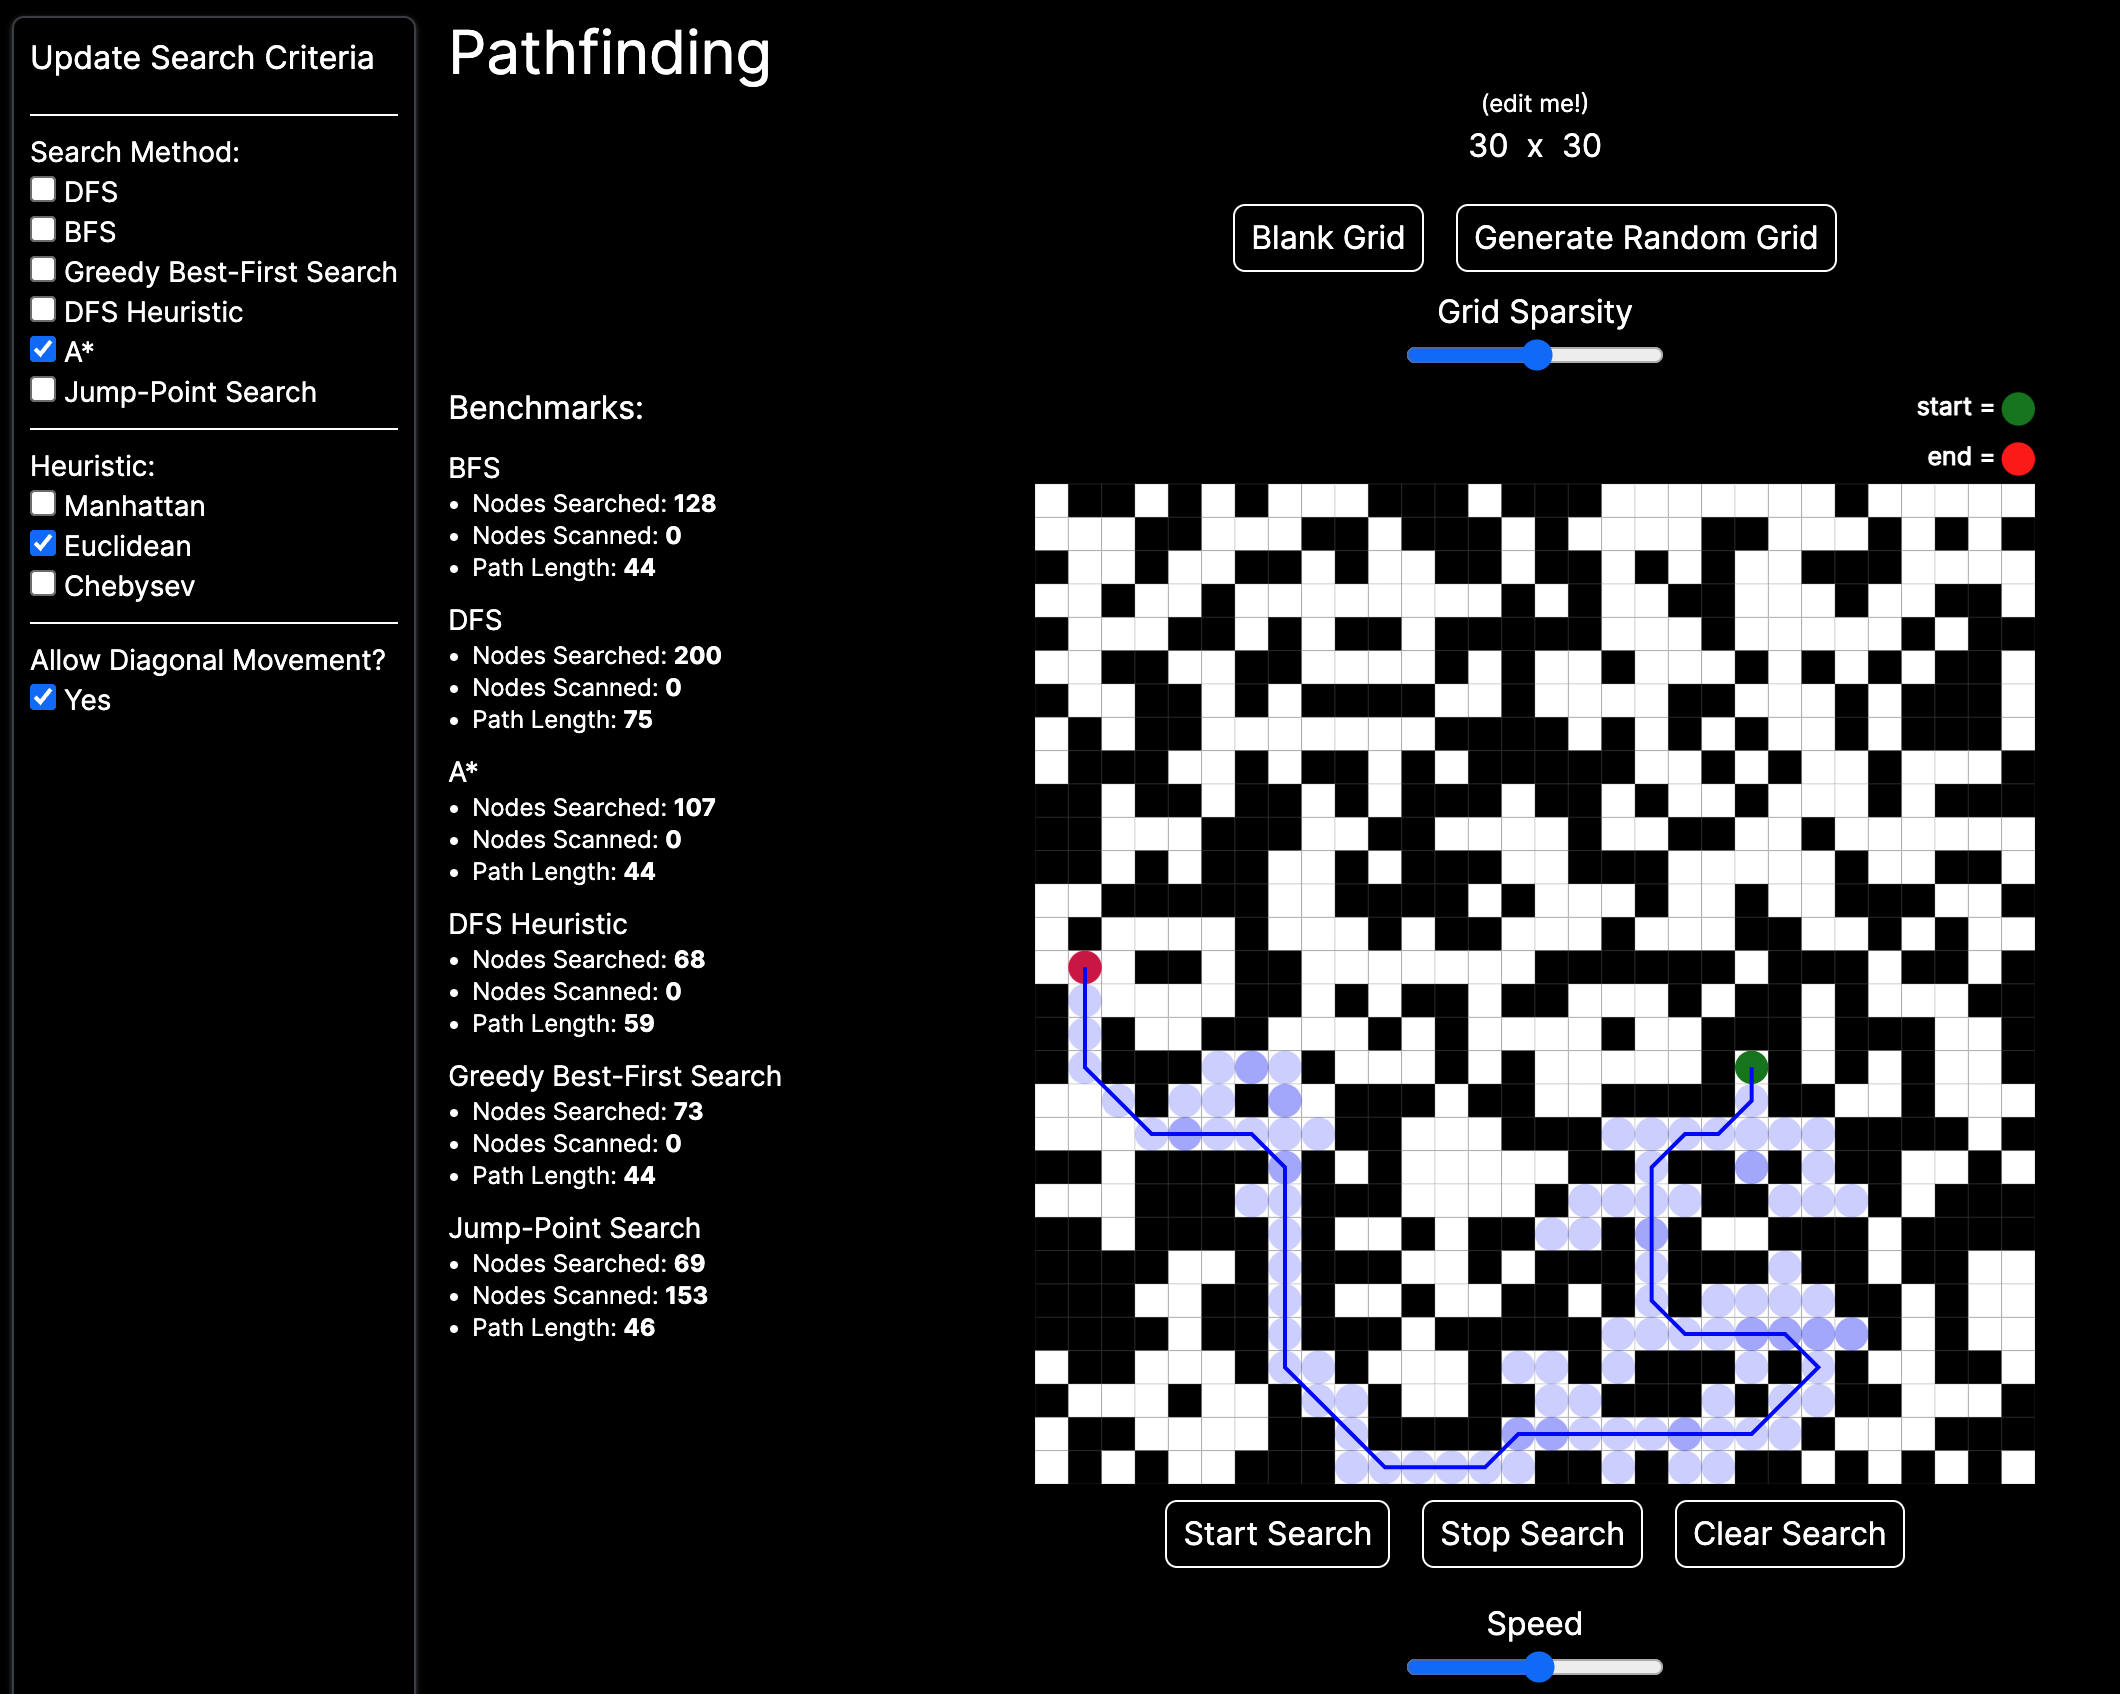
Visualize pathfinding algorithms
How to craft excellent UX for tricky data tables
Flowchart and data visualization tools
SaaS Backup Monitoring Tool for IT Data Protection
Metacloud for FinOps, CloudOps and SecOps
Create stunning animated interactive world and country maps
Share notebooks with one click in Jupyter
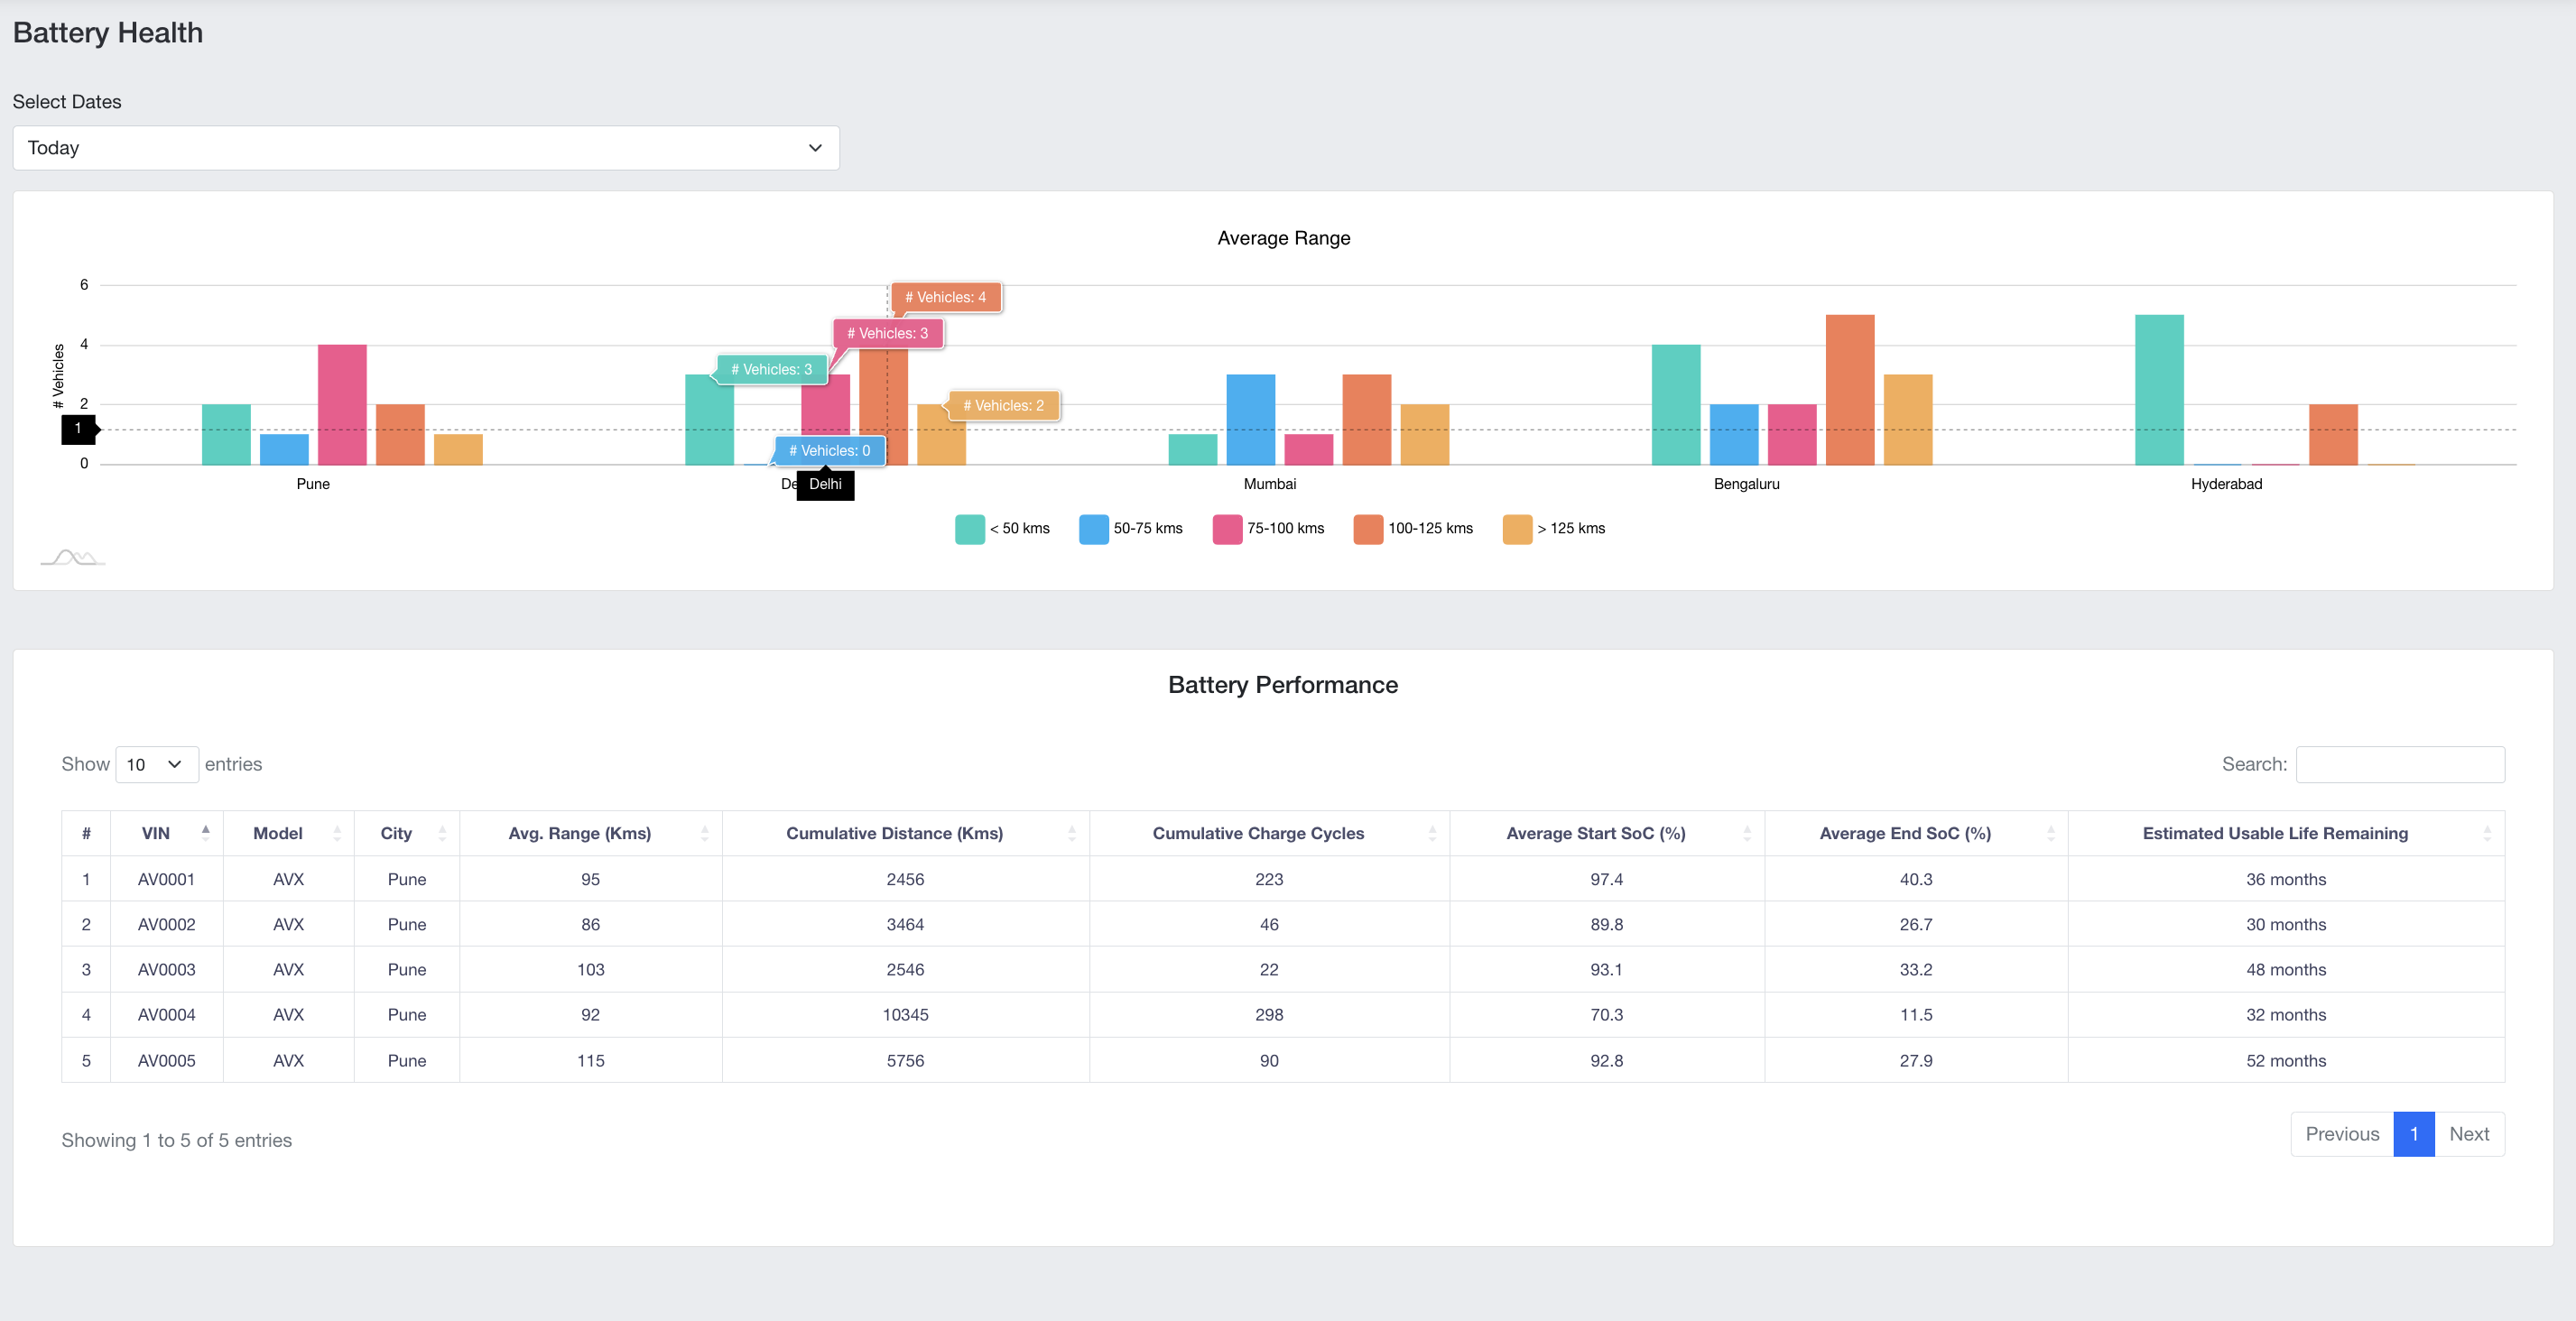
Manage EV lifecycle with highly scalable & secure servers
Discover what's happening in the world at a glance
Build production-ready web application in no time
Migrate, sync, verify and correct your database data
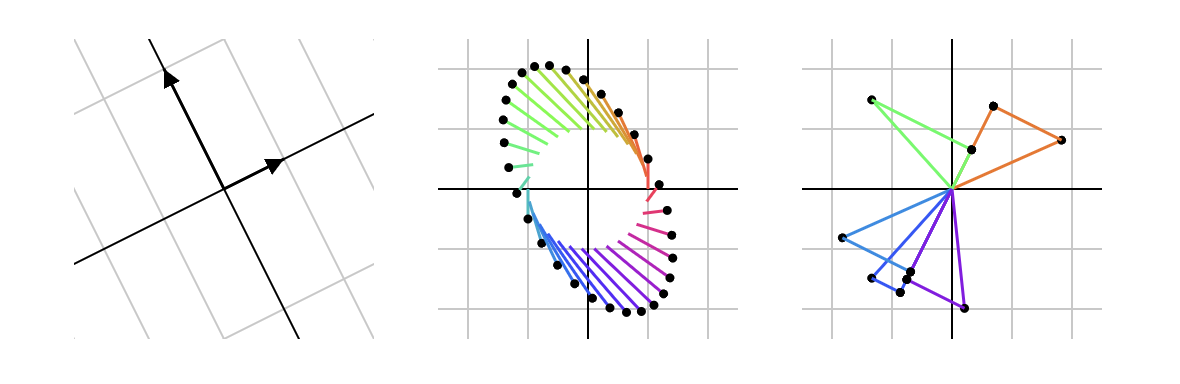
Brings data to life through captivating graphs
All your contributions in one image!
A series of visual essays packed into an e-book.
Automated finance data reports and calculations for SaaS
Python Confusion Matrix
Deep Learning Technologies Based GIS Application System
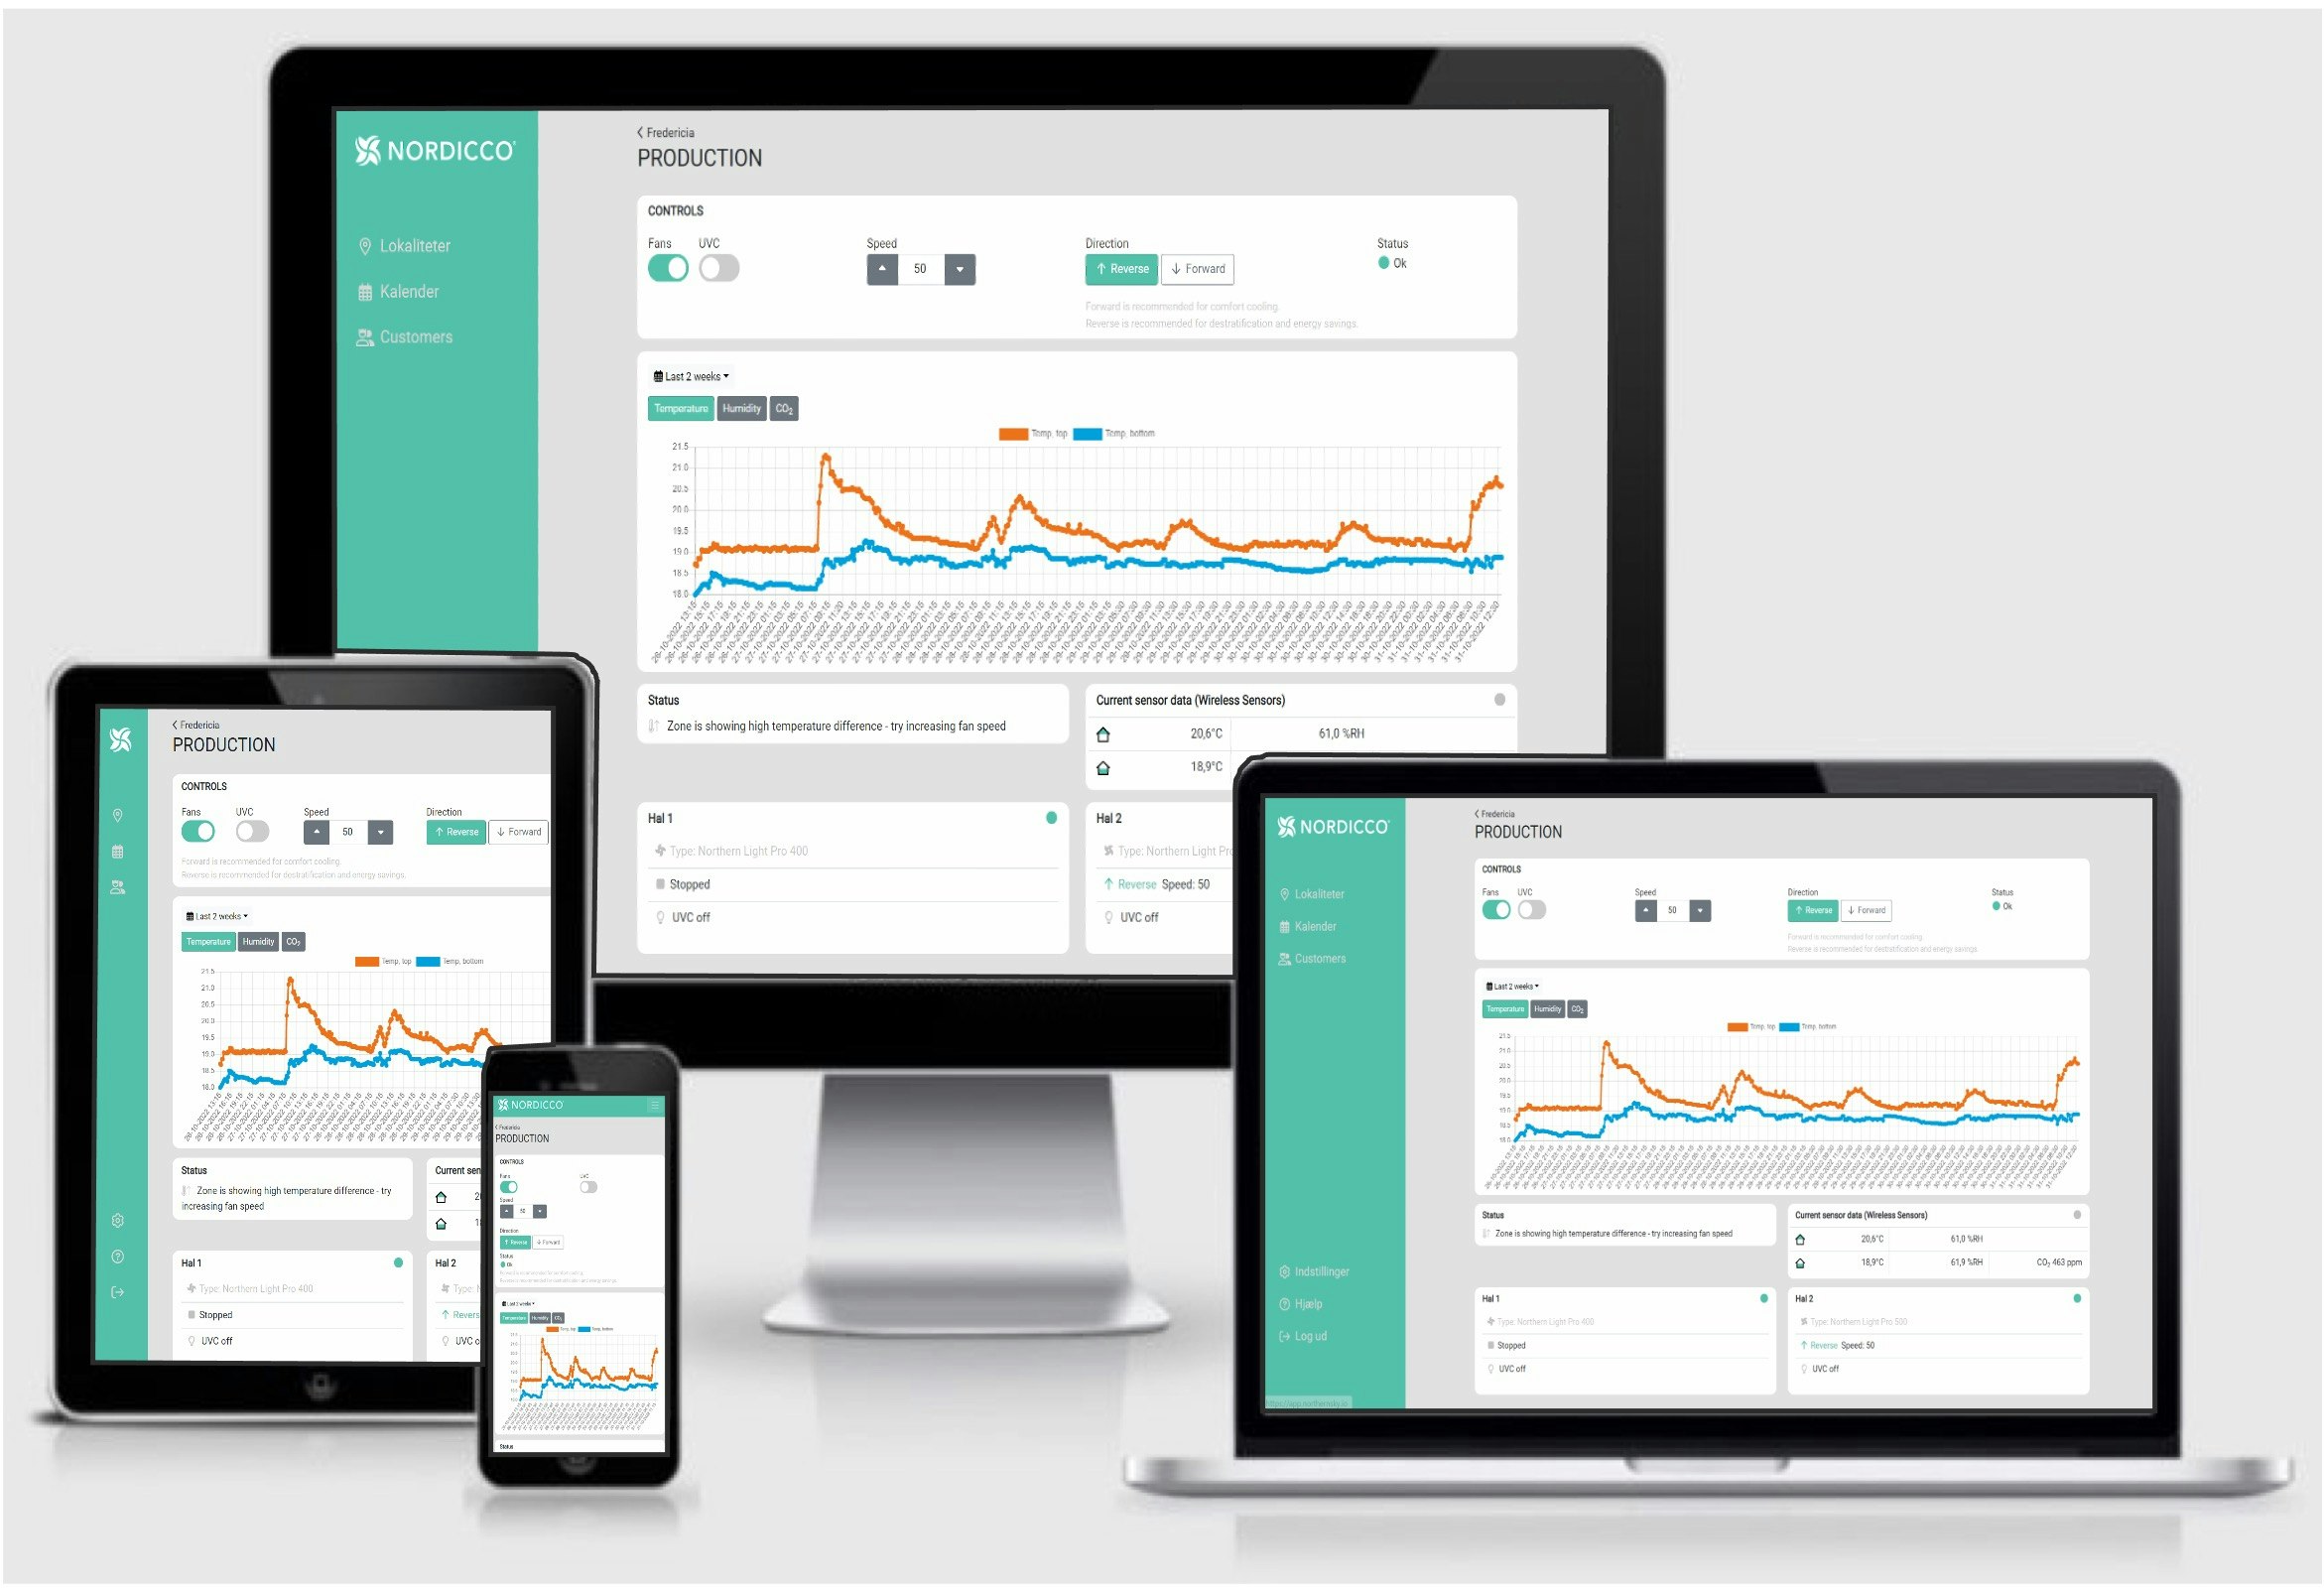
Online Fan Control & Indoor Environmental Data Visualization