Page 31
Free visual journal to make sense of your memories.
Drop your excel pivot. Ask your data for insights.
Award-winning designers at your service, top 1% talent
From data to report in one minute or less
An affordable AI-driven smart shopping cart
one sentence generates any graph
Create, manipulate and chart time series in Google Sheets.
Big data and AI hackathon - sharpen your developing skills
R package of transcriptomics visualization
Read Any API Like a Database
Collect the World.
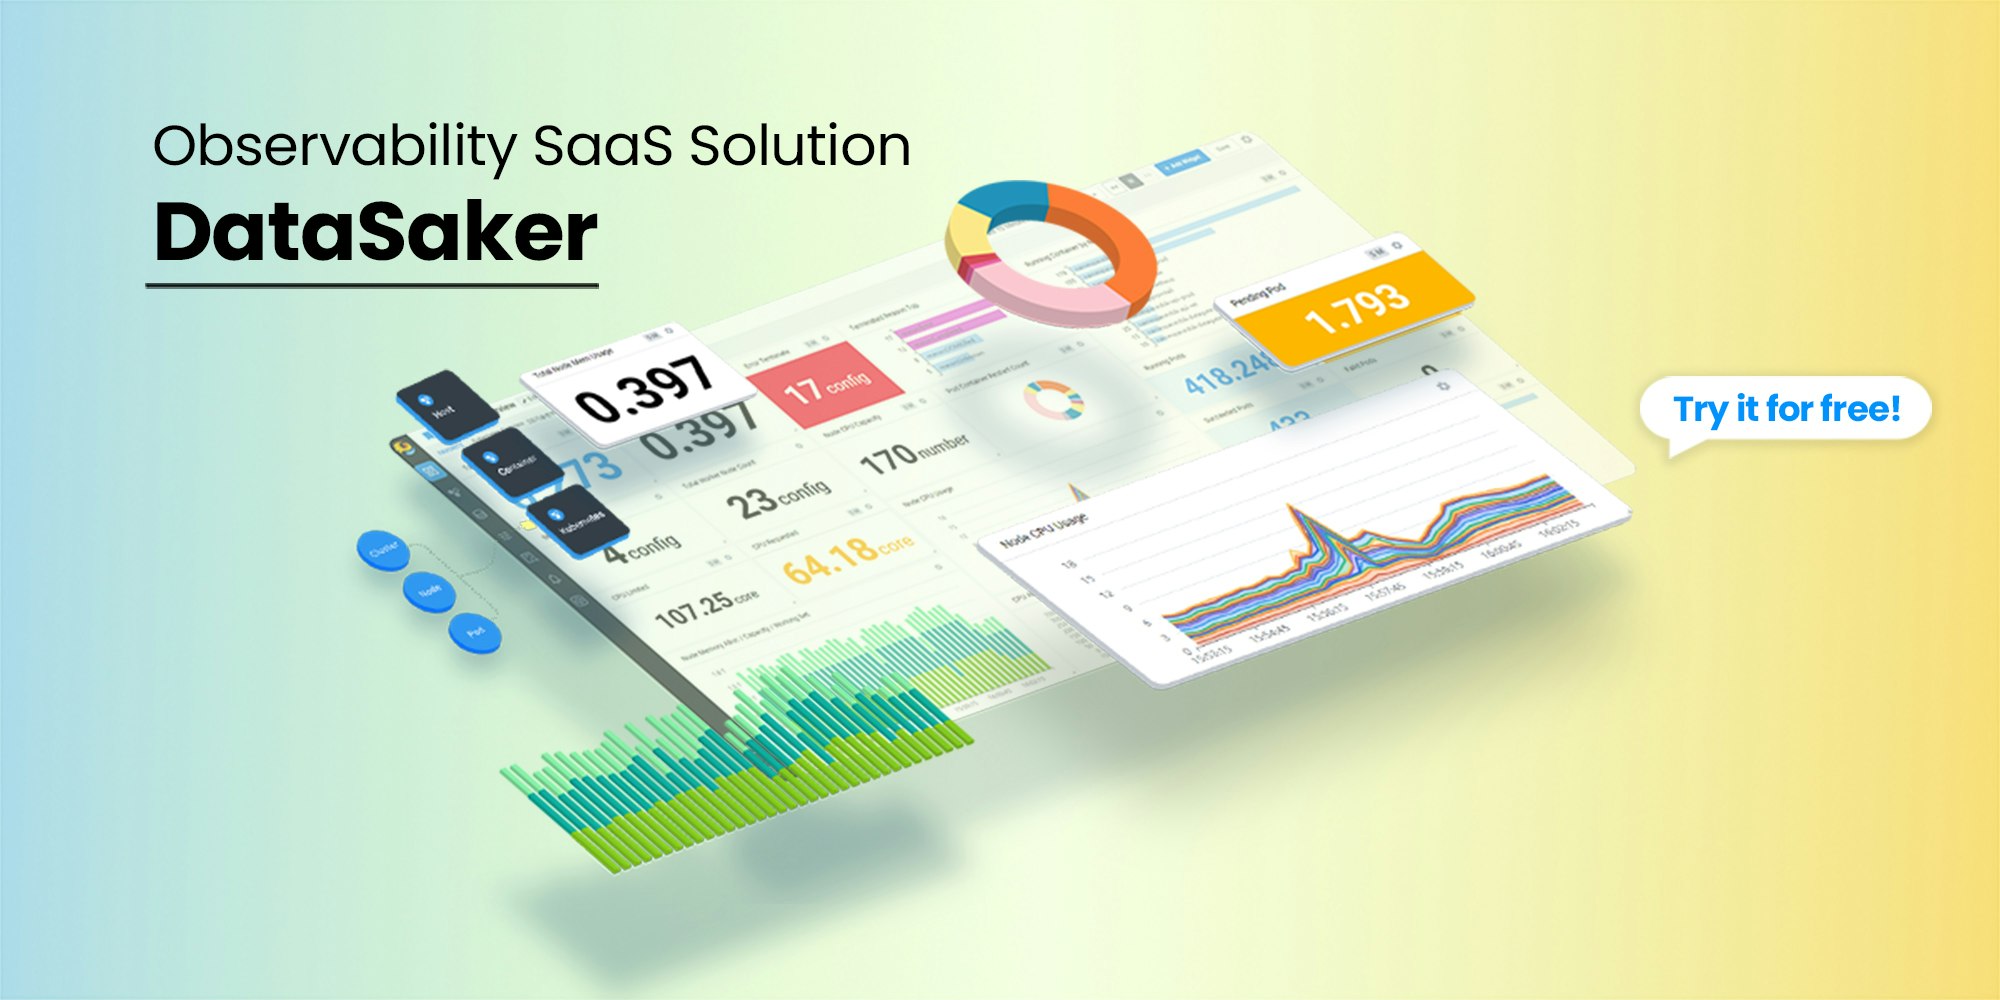
Cloud monitoring observability
We see what the hacker sees
Subscription based data analytics and visualization service
GitHub user circle generator using GitHub actions
Best Data Recovery Services in Bangalore
Crowd-sourced 3D map in your browser
It can plot the air condition on the Psychrometric Chart
Docker Swarm visualization tool
Simplifying high impact decisions through analytics