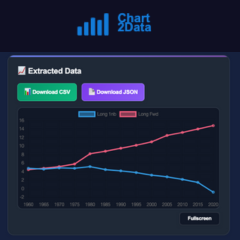
Page 13
Turn any chart into clean, usable data in seconds with AI
Explore enrollment trends and peer benchmarks w/ IPEDS data
AI-enhanced financial analytics & reporting
Fast, Free, & Open Source Chart Builder
Generate AWS network diagrams
Trends in Y Combinator Company Domains
Techno-clarity for the evolving operator.
Progress made simple. One text at a time.
✨ Structure Your Un-Structured Data with Clicks 🖱️
22+ Open-source data visualizations for React
From raw Uber data to explorable insights with one upload
Turn Tables Into Stunning Graphs-No Coding, Just Clarity!
In-depth Formula 1 race analysis through data visualization
Create beautiful diagrams. In minutes.
Living ER diagram for PostgreSQL databases
The sounds of pandemic
Compare and benchmark your e-commerce business for free
Self-Service BI Without Limits — Proven & Scalable
Beautifully-wrapped insights into your calendar
Transforming Code into Engaging Visual Timelines